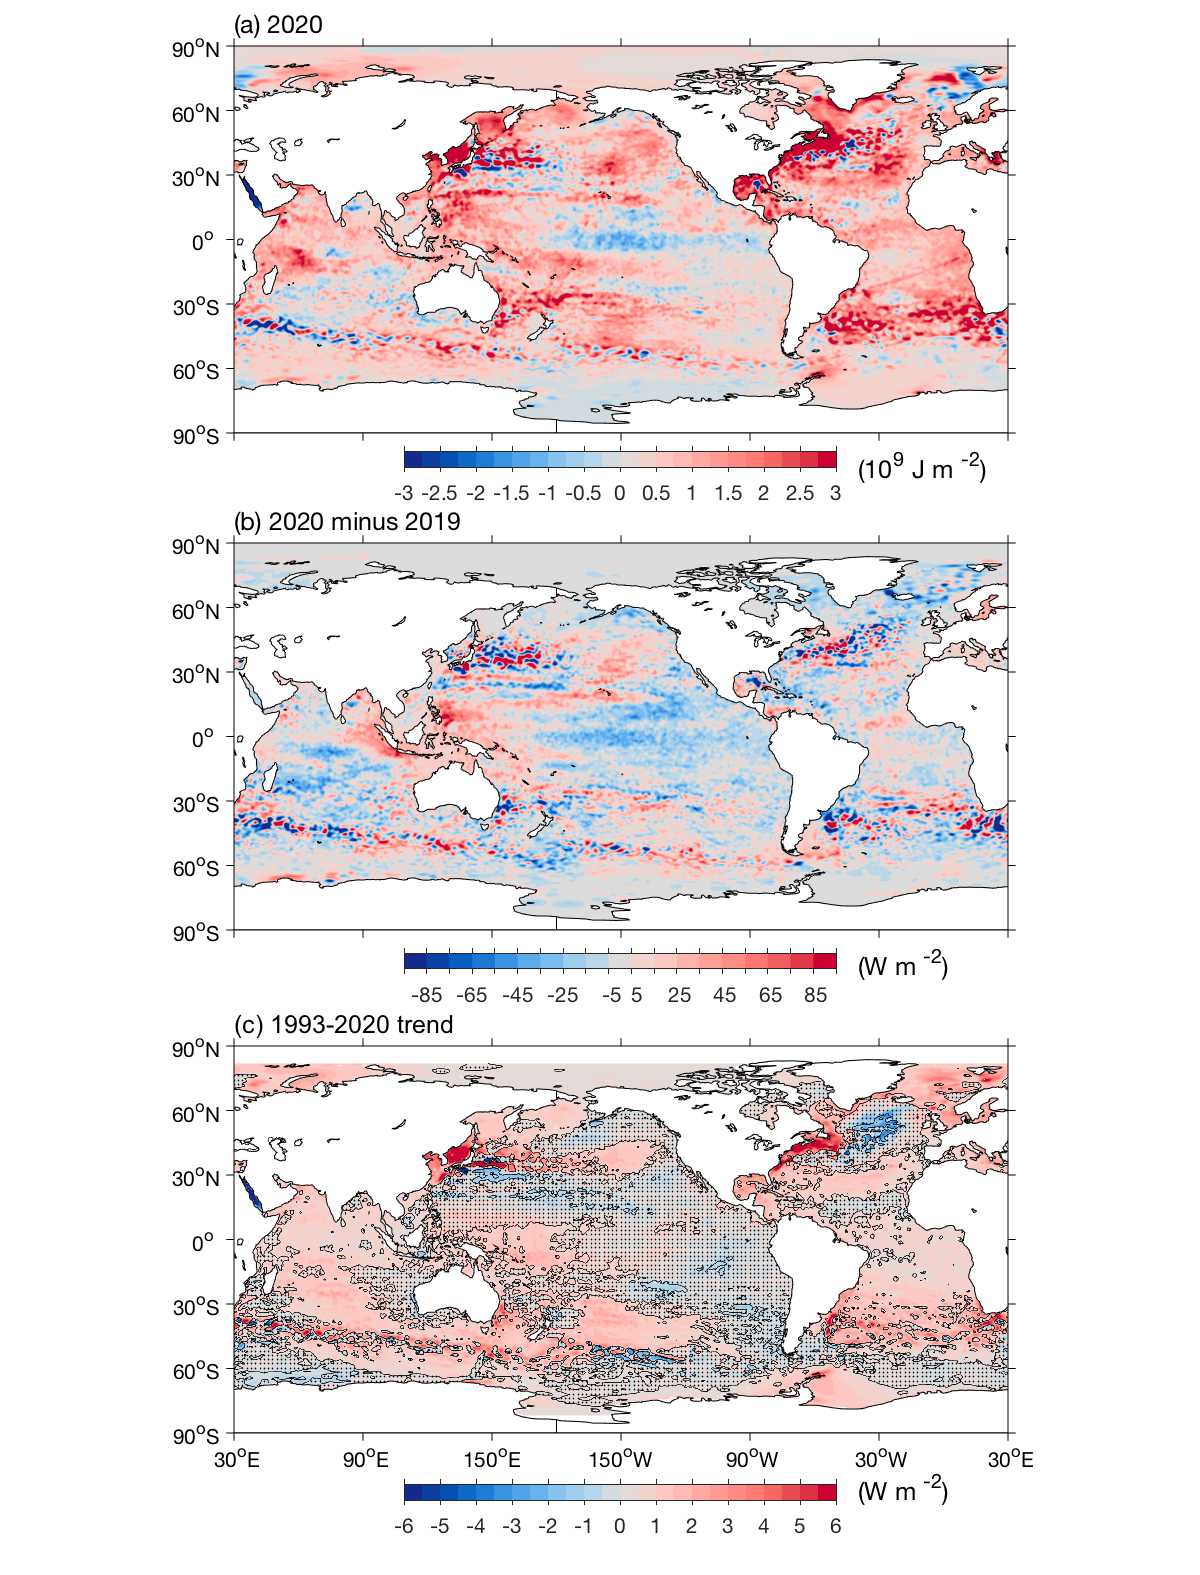
Upper Ocean Heat Content Plots
Shown below are maps of ocean heat content anomaly from both in situ data and altimeter sea surface height mapping performed according to Willis et al. 2004. Estimate of the ocean heat content anomaly for 2020 is referenced to a 1993-2020 base period (top panel). Estimate of the change in ocean heat content anomaly from 2019 to 2020 (middle panel). Linear trend for 1993-2020 of the combined estimates of upper (0-700m) annual ocean heat content anomaly (bottom panel).
These data and plots are for research purposes only. Please contact us if you wish to be informed of updates to this website and keep us informed of any publications involving the data and plots contained in this website, by sending us an e-mail.


